
Canada to Distribute Paper Straws and Drug-Testing Supplies in Federal Prisons

Correctional Service Canada is expanding its harm-reduction programs to include supplies for snorting and smoking drugs, raising questions about prison security, addiction treatment and the ongoing challenge of keeping illegal substances out of federal institutions.

The Correctional Service of Canada (CSC) has confirmed plans to distribute paper straws, foil strips and drug-testing supplies to federal inmates as part of an expanded harm-reduction initiative.

The decision, first reported by the National Post on September 27, 2026, follows an internal staff memorandum outlining additional supplies intended to reduce the health risks associated with illicit drug use inside federal correctional facilities.

Under the initiative, paper straws will be made available for snorting powdered substances, while foil strips will be provided for smoking. Testing strips capable of detecting fentanyl, benzodiazepines and xylazine are also included in the expansion.

The measures reflect a broader shift in Canada’s correctional approach to substance use, emphasizing overdose prevention and infectious disease reduction alongside traditional enforcement and addiction treatment.

However, the initiative also raises questions about how correctional authorities intend to balance harm reduction with their responsibility to prevent illegal drugs from entering prisons.

Internal memorandum confirms expanded drug-use supplies

According to the National Post’s reporting, the initiative became public after photographs of an internal CSC memorandum circulated on social media.

The document described the introduction of additional harm-reduction supplies in response to increased reports of inmates inhaling, smoking and snorting substances.

CSC communications officer Laurence Côté subsequently confirmed to the newspaper that the memorandum was authentic and had been prepared to inform employees about the expansion.

The reported supplies include:

  • Paper straws: Intended to reduce nasal injuries and the sharing of improvised equipment.

  • Foil strips: Provided as part of safer-smoking initiatives.

  • Fentanyl testing strips: Intended to help identify the presence of the powerful synthetic opioid.

  • Benzodiazepine testing strips: Designed to detect certain sedative substances.

  • Xylazine testing strips: Intended to identify a veterinary sedative increasingly associated with the contaminated drug supply.

The memorandum reportedly instructs staff that possession of these supplies alone should not result in criminal charges.

However, where supplies are discovered alongside illegal drugs or unauthorized paraphernalia, existing operational procedures are to remain in effect.

The distinction is important: the new policy addresses the possession of specific harm-reduction equipment, rather than authorizing the possession of illicit substances.

The announcement does not establish that every federal institution has already begun distributing the supplies, and a complete institution-by-institution implementation schedule has not been confirmed in the reporting reviewed.

Source: National Post reporting, September 27, 2026.

Why are paper straws being distributed?

The reasoning behind the paper straws is primarily medical.

According to the British Columbia Centre for Disease Control, improvised snorting equipment can cause cuts and irritation inside the nose.

When equipment is shared, blood from damaged nasal passages can potentially transmit infections, including hepatitis B and hepatitis C.

Paper straws are intended to reduce some of these risks by providing a disposable alternative to harder materials.

The B.C. Centre for Disease Control’s harm-reduction guidance also recommends that straws not be shared or reused.

However, the agency cautions that paper straws should not be used to inhale vapours from substances heated on foil because they can ignite and cause burns.

That warning is particularly relevant because the reported CSC memorandum describes the supplies as being intended for both powdered substances and inhaled vapours.

Providing disposable equipment does not eliminate the risks associated with consuming illegal drugs, including poisoning, addiction and fatal overdose.

It addresses specific risks associated with the equipment used.

Sources: B.C. Centre for Disease Control and CATIE, Canada’s national HIV and hepatitis C information organization.

Federal prison survey reveals extent of illegal drug use

The announcement comes against a backdrop of documented substance use within Canada’s federal prison system.

A Correctional Service of Canada national health survey conducted in 2022 provides insight into the scale of the problem.

Among 1,404 inmates who participated in the survey, 413 reported using substances inside federal prisons during the preceding six months.

That represents approximately 29% of respondents.

CSC NATIONAL HEALTH SURVEY · 2022

29%

of surveyed federal inmates reported using drugs in prison during the previous six months.

Among the 413 respondents who reported drug use:

Smoked substances

78%

323 respondents

Snorted substances

63%

260 respondents

Injected substances

12%

51 respondents

Categories overlap because some respondents reported more than one method of drug use. Percentages are rounded.

The survey also revealed that sharing drug-use equipment was relatively common.

Among respondents who reported snorting substances, approximately 49% said they had shared devices used for that purpose.

Among those who reported smoking substances, approximately 45% reported sharing smoking equipment.

The findings demonstrate why correctional health authorities have focused on infectious disease transmission.

They also illustrate a fundamental challenge facing prison administrators: significant levels of illicit drug use have persisted despite institutional security measures and prohibitions.

The figures are from 2022 and should not be interpreted as measurements of drug use in September 2026.

Source: Correctional Service of Canada, 2022 National Health Survey.

Drug use in prisons is not a new problem

The distribution of paper straws is the latest development in a federal correctional strategy that has gradually expanded beyond conventional drug enforcement.

In 2018, CSC introduced its Prison Needle Exchange Program, allowing eligible inmates to access sterile injection equipment under controlled conditions.

The initiative was designed to reduce the transmission of blood-borne infections associated with sharing needles.

A separate Overdose Prevention Service began operating at Drumheller Institution in Alberta in June 2019.

The program subsequently expanded to other federal institutions, including Springhill Institution in Nova Scotia.

According to CSC’s May 2026 briefing materials, the needle exchange program had been implemented at 13 institutions as of February 2026.

Overdose prevention services were available at five institutions:

  • Drumheller Institution, Alberta

  • Springhill Institution, Nova Scotia

  • Collins Bay Institution, Ontario

  • Drummond Institution, Quebec

  • Warkworth Institution, Ontario

The overdose prevention program allows participating inmates to use substances under the observation of health-care professionals who can respond to medical emergencies.

CSC states that it does not provide the drugs used by inmates through this program.

The department also reported that, as of its May 2026 briefing, there had been no fatalities among participants using its overdose prevention services.

That result describes the experience of program participants; it does not establish that overdose deaths have been eliminated throughout the federal prison system.

Source: CSC’s May 28, 2026, briefing to the House of Commons Standing Committee on Public Safety and National Security.

Addiction treatment remains a major challenge

Beyond the immediate question of drug-use equipment lies the larger issue of substance dependence among people entering Canada’s correctional system.

CSC’s 2026 briefing materials indicate that problematic alcohol or substance use is widespread among incoming federal offenders.

The department reported lifetime prevalence rates of approximately 66% among men and 61.6% among women at admission.

Its research also found that nearly half of incoming male offenders assessed had a current substance-use problem.

These findings help explain why addiction treatment and drug-related health services occupy a substantial place in federal correctional policy.

CSC’s National Drugs and Substance Strategy combines several approaches, including prevention, addiction counselling, medication-assisted treatment, harm reduction and support for inmates returning to the community.

The department has also modified its approach to medications used to treat opioid dependence.

Effective October 1, 2025, long-acting injectable buprenorphine became the first-line treatment for opioid use disorder within the federal correctional system.

Methadone was designated a second-line open benefit, while daily buprenorphine-naloxone was moved toward restricted formulary access.

The changes were intended to strengthen treatment while reducing the potential misuse or diversion of certain medications.

The introduction of paper straws and drug-testing strips represents another component of this broader strategy rather than a replacement for addiction treatment.

Source: CSC, 2026–27 Main Estimates briefing materials.

Harm reduction and prison security present competing priorities

The expansion brings two longstanding correctional responsibilities into focus.

The first is the obligation to protect the health and safety of people held in federal custody.

The second is the responsibility to maintain secure institutions and prevent prohibited substances from entering or circulating within them.

Harm-reduction programs are based on the premise that some people will continue using drugs despite prohibitions and treatment opportunities.

Providing sterile or disposable equipment is intended to reduce the medical consequences of that behaviour.

From a public-health perspective, preventing an infectious disease or fatal overdose can be a meaningful outcome even when substance use continues.

However, the availability of drug-use equipment also raises operational questions.

Correctional staff must determine how the supplies will be distributed, monitored and managed within facilities where contraband control remains a central responsibility.

Questions also remain about whether expanding access to harm-reduction equipment will affect demand for addiction treatment or patterns of illicit drug use.

Those outcomes cannot be established from the announcement alone.

The federal government’s existing briefing materials describe safeguards for its needle exchange program, including individual threat-risk assessments and procedures for storing and accounting for equipment.

Whether comparable procedures will govern the newly announced supplies has not been fully detailed in the available reporting.

Will the new measures reduce overdoses?

The effectiveness of the initiative will ultimately depend on measurable health and operational outcomes.

Drug-testing strips may help identify certain substances in a drug sample, but they cannot guarantee that a substance is safe to consume.

Similarly, disposable snorting equipment can reduce some risks associated with sharing contaminated devices without preventing an overdose.

The distinction matters because harm reduction and addiction treatment address different aspects of the same problem.

Harm reduction attempts to limit the immediate consequences of substance use.

Treatment aims to help individuals manage or overcome substance dependence.

Security and enforcement measures, meanwhile, attempt to prevent illegal drugs from entering correctional institutions.

CSC’s stated strategy incorporates all three approaches.

The available evidence establishes that drug use and equipment sharing have occurred in federal prisons, but it does not yet establish how the newly announced supplies will affect future overdose rates, institutional security or drug consumption.

Those questions will require implementation data and subsequent evaluation.

What happens next?

The confirmation that paper straws, foil strips and additional testing supplies will be introduced into federal prisons marks another development in Canada’s approach to managing substance use behind bars.

For correctional authorities, the immediate objective is to reduce preventable injuries, infections and overdoses among inmates who continue using drugs.

For those concerned about prison security, the expansion raises questions about how harm-reduction programs will operate alongside efforts to intercept contraband and enforce institutional rules.

The central issue is not whether illegal drugs are present in Canadian prisons. CSC’s own research has already documented that reality.

The unanswered questions concern whether the expanded measures will produce measurable improvements in health, how they will affect prison operations and whether they will be accompanied by effective addiction treatment and drug-interdiction efforts.

As the new supplies are introduced, those outcomes will provide a clearer basis for assessing the policy.

Canadian Students Are Paying More to Get Ahead — and the Debt Is Following Them

The price of a Canadian education is no longer just tuition. For many students, housing, food, transportation and debt are turning post-secondary education into a financial gamble.

For generations, Canadians have been told that post-secondary education is one of the safest investments a young person can make.

A degree or diploma is supposed to open doors, increase earning power and provide a path toward a more secure future.

But that calculation is becoming increasingly complicated.

The latest numbers from Ottawa show that the federal student-loan system is carrying tens of billions of dollars in outstanding debt, while government projections indicate that billions more could ultimately be written off through defaults.

At the same time, students are entering classrooms facing not only tuition bills, but also dramatically higher costs for housing and everyday necessities.

The result is a growing question for Canadian families: How much should a student borrow for an education, and how certain is the payoff?

Tuition is only the beginning

Statistics Canada estimates that the average Canadian undergraduate paid $7,734 in tuition for the 2025–26 academic year.

That national average hides enormous differences.

Average undergraduate tuition was approximately $8,958 in Ontario, $9,863 in Saskatchewan, $9,938 in New Brunswick and $9,988 in Nova Scotia.

By comparison, average undergraduate tuition was just $3,963 in Quebec and $3,746 in Newfoundland and Labrador.

And tuition is only one line on a student’s budget.

A student living away from home also has to pay for rent, food, transportation, books, technology, utilities and other necessities.

For students in Canada’s most expensive housing markets, accommodation can easily become one of the largest costs of attending school.

That means the real price of obtaining a degree can be several times higher than the tuition figure printed on a university website.

Ottawa has increased student assistance — but so has the debt exposure

The federal government has responded to affordability concerns by substantially increasing student assistance.

For 2026–27, the maximum Canada Student Loan for a full-time student remains $300 per week, while the maximum Canada Student Grant for full-time students is $525 per month of study.

Those measures are designed to make post-secondary education more accessible.

But loans still have to be repaid.

And Ottawa’s own actuarial figures show just how large the system has become.

As of July 31, 2026, the federal direct student-loan portfolio stood at approximately $32.1 billion.

The Office of the Chief Actuary projects that the portfolio could grow to approximately $48.2 billion over the projection period.

It also estimates a long-term net default rate of 7.1%.

That doesn’t mean 7.1% of today’s entire student-loan portfolio will suddenly disappear.

Student-loan defaults occur over time, and the government’s calculation accounts for repayments, rehabilitation, recoveries and eventual write-offs.

But the direction is significant.

The actuarial report projects the balance of defaulted direct loans increasing from approximately $2.76 billion in 2025–26 to $3.14 billion by 2029–30, before continuing higher in subsequent years.

Not every student faces the same risk

One of the most important details gets lost when Canada’s student-debt problem is reduced to a single national number.

The risk of default varies substantially depending on where a student studies.

Federal statistics show that the latest published three-year default rate for full-time direct-loan borrowers was 4.8% for university students, compared with 9.0% for college students.

For students attending private institutions, the rate was 15.8%.

Ottawa has subsequently highlighted a similar disparity while explaining changes to federal student assistance.

The government says student-loan default rates at private for-profit post-secondary institutions are approximately 16%, compared with about 5% for university students and 9% for public college students.

That difference matters.

It suggests that the financial risk of borrowing for education isn’t determined solely by how much a student borrows.

The institution, program, employment prospects and eventual income can all influence whether that debt becomes manageable.

Ottawa is increasingly worried about the institutions receiving the money

The federal government has also been examining whether public student assistance is flowing toward programs that produce sufficiently strong outcomes.

In documents supporting changes to Canada’s student-assistance system, Ottawa says the number of grant and loan recipients at private for-profit post-secondary institutions more than doubled between 2018–19 and 2023–24.

During the same period, the number of recipients at universities remained relatively stable, while college recipients declined.

The government also says the number of recipients of the Canada Student Grant for Full-Time Students at private for-profit institutions nearly tripled, from approximately 23,000 in 2018–19 to 66,000 in 2023–24.

That growth has prompted Ottawa to change eligibility rules for some federal grants beginning in the 2026–27 school year.

The federal government argues that public funding should be concentrated on institutions and programs that provide stronger outcomes and reduce financial risk for both students and taxpayers.

The $31,700 number needs some context

The headline figure circulating in the current debate — $31,700 — deserves careful interpretation.

It is not the average amount every Canadian student spends each year.

Nor is it the average student-loan balance.

The actual cost of education varies dramatically depending on the province, institution, program and whether a student lives at home.

For example, a student living with parents in Quebec can face a radically different annual bill from a student renting an apartment in Toronto, Vancouver or another high-cost city.

The important point is therefore not that every student faces a $31,700 annual bill.

It is that the financial commitment associated with post-secondary education can be far greater than tuition alone suggests.

And when that additional cost is financed with borrowed money, students aren’t simply paying today’s expenses.

They’re committing part of tomorrow’s income.

Education still pays — but the numbers matter

None of this means Canadians should abandon post-secondary education.

There is strong evidence that education can improve lifetime earning potential.

The federal government says 2021 Census data show that Canadians with bachelor’s degrees had median incomes 38% higher than high-school graduates, while those with college diplomas had median incomes 14% higher. People with education beyond a bachelor’s degree had a median-income advantage of approximately 50% over high-school graduates.

The problem is that averages don’t guarantee individual outcomes.

A student can graduate with a credential and still struggle to find well-paid work.

A program can be academically valuable without producing enough income to comfortably service substantial debt.

And a student who spends four years paying tuition and living expenses may emerge into the workforce with thousands of dollars in obligations before making their first full-time salary.

That makes the choice of program increasingly important.

The real question for students

The debate over student debt shouldn’t simply be about whether governments should provide more money.

It should also be about whether students are getting enough information to determine when borrowing makes financial sense.

Before taking on debt, students and families should be asking:

  • What will the entire program cost — not just tuition?

  • Will I need to borrow for housing and living expenses?

  • What jobs does this program realistically lead to?

  • What do graduates in those occupations typically earn?

  • How long could it take to repay the debt?

  • Could I complete the program while living at home?

  • Is there a less expensive institution offering comparable training?

  • What happens financially if I don’t complete the program?

Those questions aren’t anti-education.

They’re basic financial planning.

Canada’s student-debt problem isn’t going away

Ottawa’s own projections make one thing clear: Canada’s student-loan system is enormous and expected to remain so.

The government estimates that roughly 720,000 students will benefit from the continuation of enhanced federal student assistance during the 2026–27 academic year.

The same regulations are expected to generate approximately $1 billion in additional student loans during that year alone.

The government estimates a roughly 6% risk provision on those additional loans, reflecting the possibility that some will not ultimately be repaid.

Meanwhile, the federal actuarial report expects the overall student-loan portfolio to continue growing and projects billions of dollars in future defaults.

For students, that creates a difficult balancing act.

Education can still be one of the best investments a young Canadian can make.

But an investment is only a good investment when the expected return justifies the cost.

As tuition, housing and other expenses continue to shape the price of a post-secondary education, students and families may need to think less about whether they can somehow afford to attend — and more about whether the particular education they are buying is worth the debt required to obtain it.

That may be the most important financial lesson of all.

Ottawa Extends Federal Fuel Tax Relief Into 2027

Canadian Taxpayers Federation welcomes extension but calls on the government to make the fuel-tax cut permanent

The federal government is extending its temporary suspension of the federal fuel excise tax on gasoline and diesel, keeping the full tax reduction in place through January 31, 2027.

The announcement comes as the government had been scheduled to restore the federal fuel excise tax on September 8. Under the extension, gasoline and diesel will continue to benefit from the temporary tax relief through January, followed by a phased return to the regular rates beginning in February.

The Canadian Taxpayers Federation (CTF) welcomed the extension but said Ottawa should go further and make the reduction permanent.

Gasoline tax remains at zero

The federal excise tax on gasoline is normally 10 cents per litre, while the federal excise tax on diesel is normally 4 cents per litre.

Those rates were reduced to zero beginning April 20, 2026, as part of the government’s response to elevated fuel prices and international energy-market disruptions.

The temporary suspension was originally scheduled to end September 7, with the full tax returning the following day.

The new proposal extends the zero-rate period through January 31, 2027. Beginning February 1, the government plans to restore half of the regular federal excise tax until March 31.

That means the federal rates would temporarily become:

  • 5 cents per litre on gasoline
  • 5.5 cents per litre on leaded aviation gasoline
  • 2 cents per litre on diesel
  • 2 cents per litre on other aviation fuel

The full rates are scheduled to return April 1, 2027.

Taxpayers federation calls for permanent cut

The Canadian Taxpayers Federation praised the extension, arguing that lower fuel taxes can benefit both drivers and businesses.

Franco Terrazzano, the organization’s federal director, said the CTF had been advocating for fuel-tax relief and that extending the measure would provide additional assistance to Canadians facing higher costs.

The organization is now calling on Prime Minister Mark Carney’s government to make the reduction permanent rather than allowing the tax to return to its previous level.

Kris Sims, the CTF’s Alberta director, similarly argued that Ottawa should reduce government spending to make permanent tax relief possible without increasing government debt.

Poll finds opposition to restoring the tax

The CTF said a Léger poll it commissioned found significant opposition to restoring the federal fuel tax at its previous level.

According to the organization, 63 per cent of Canadians surveyed opposed increasing the gas tax in September. Among respondents who had made a decision on the question, the opposition rate was 71 per cent.

The CTF said opposition was recorded across demographic groups, including different age groups, genders and provinces.

The poll was commissioned by the CTF, meaning its results should be considered in that context rather than as a government survey.

Ottawa says the measure is temporary

The federal government has presented the fuel-tax suspension as a temporary affordability measure.

When the original reduction was announced in April, Finance Canada said eliminating the federal excise tax would save motorists up to 10 cents per litre on gasoline and 4 cents per litre on diesel. The government estimated the initial suspension would provide more than $2.4 billion in tax relief during 2026.

The measure applies to the federal excise tax. It does not eliminate provincial fuel taxes or other charges that can affect the price motorists see at the pump.

The government also continues to apply sales taxes to fuel.

Different from the former carbon price

The fuel-tax suspension should also be distinguished from the federal consumer carbon price.

Ottawa permanently removed the federal consumer fuel charge from legislation earlier this year. That measure eliminated the federal consumer-facing carbon price, while the current gasoline and diesel excise-tax suspension is a separate measure.

The distinction matters because the two taxes have different purposes and operate through different parts of Canada’s tax system.

What happens next?

The government’s September 2026 legislative proposal would keep federal fuel excise taxes at zero through January and then restore them gradually.

The proposed timeline is:

April 20, 2026 – January 31, 2027:
Federal gasoline and diesel excise taxes remain at zero.

February 1 – March 31, 2027:
Half the normal excise-tax rates apply.

April 1, 2027:
Regular federal excise-tax rates are scheduled to return.

The Department of Finance’s legislation confirms that the extension is designed around this staged return.

For motorists, the immediate result is that the federal portion of fuel taxation will remain suspended beyond the original September deadline.

For the Canadian Taxpayers Federation, however, the extension doesn’t go far enough.

The organization argues that if Ottawa can temporarily eliminate the tax while maintaining government operations, it should look for permanent spending reductions that would allow Canadians to keep the tax savings.

The federal government, meanwhile, continues to characterize the measure as temporary relief.

The debate has therefore shifted from whether Canadians should receive a fuel-tax break to whether the reduction should become a permanent part of Canada’s tax system.

Sources: Canadian Taxpayers Federation and Department of Finance Canada. The CTF’s statements and polling claims are attributed to the organization, while the tax rates and implementation timeline have been cross-checked against the federal government’s legislative proposal.

Canada Imposes Temporary Duties on Chinese Plywood After Dumping Investigation

CBSA finds preliminary evidence of dumping and subsidization as Canadian producers report lost sales and declining market share

Canada has imposed provisional duties of up to 227.5 per cent on certain plywood imported from China after the Canada Border Services Agency (CBSA) made preliminary determinations that the products were being dumped and subsidized.

The measures took effect August 24 and apply to decorative and other non-structural plywood originating in or exported from China. The investigation remains ongoing, meaning the preliminary findings are not yet final.

The case began after Columbia Forest Products, along with the Canadian Hardwood Plywood and Veneer Association, filed a complaint with the CBSA in February alleging that increasing Chinese imports were being sold at unfair prices and were harming Canadian producers.

Two other Canadian manufacturers, Husky Plywood and Rockshield Engineered Woods Products, also supported the complaint.

Chinese imports gained ground in Canada

CBSA data indicates that China accounted for an increasing share of Canada’s decorative plywood imports between 2023 and 2025.

Chinese products represented approximately:

  • 63.4 per cent of Canadian decorative plywood import value in 2023
  • 61.4 per cent in 2024
  • 67.5 per cent in 2025

Over the same period, the domestic industry’s share of the apparent Canadian market fell from 42.7 per cent to 37.3 per cent.

China’s share of the overall Canadian market increased from 36.3 per cent in 2023 to 42.4 per cent in 2025, according to CBSA estimates.

The figures are based on import value rather than physical volume, because the agency encountered inconsistencies in how imported plywood quantities were reported.

What is “dumping”?

Under Canada’s trade-remedy system, dumping generally occurs when a product is exported to Canada at a price below its applicable normal value.

Canadian producers alleged that Chinese plywood was being sold below fair market value while manufacturers also benefited from government subsidies.

The CBSA’s investigation found sufficient evidence to proceed with both dumping and subsidy investigations. The agency also said there was reasonable evidence that government influence could be affecting prices in China’s engineered-wood sector.

The CBSA estimated an overall dumping margin of 33.8 per cent during its investigation period.

Duties vary dramatically by exporter

The provisional duties are not the same for every Chinese exporter.

For example, CBSA’s preliminary determinations established provisional rates including:

ExporterProvisional duty
Dehua TB New Decoration Material43.3%
Feixian Jianhao Wood Factory172.1%
LinYi QianFeng Wood Factory82.8%
Shandong Baozhu International Trading173.6%
Suzhou Dongsheng Wood24.7%
Xuzhou Meibang Wood12.6%
All other exporters227.5%

The rates combine applicable anti-dumping and countervailing duties. Some exporters had subsidy amounts below Canada’s threshold for imposing a provisional countervailing duty.

The 227.5 per cent figure therefore does not apply automatically to every Chinese plywood shipment. It applies to subject goods from exporters that have not received a specific provisional rate.

Canadian producers cite lost sales and jobs

The domestic producers told the CBSA that increasing Chinese imports were contributing to lost sales and market share.

The complaint included examples of sales lost to Chinese products, along with allegations of price undercutting, price depression and price suppression.

The producers also reported negative effects on financial performance, production levels, capacity utilization and employment.

After reviewing information supplied by the producers and its own customs data, the CBSA concluded there was a reasonable indication that the allegedly dumped and subsidized imports had caused injury to Canada’s domestic decorative plywood industry.

The Canadian International Trade Tribunal reached a similar preliminary conclusion in June, determining that there was a reasonable indication that dumping and subsidization had caused or threatened to cause injury to the domestic industry.

What products are affected?

The investigation covers decorative and other non-structural plywood, including certain multilayered plywood and veneered panels.

These products can be used in applications such as cabinetry, furniture and interior finishing.

The measures do not cover every type of plywood. CBSA specifically excludes certain structural plywood, finished plywood flooring products, specially shaped panels and several other products from the scope of the investigation.

Final decision still months away

The current duties are provisional rather than permanent.

The CBSA is scheduled to issue its final determinations on dumping and subsidization on November 23, 2026.

The Canadian International Trade Tribunal is conducting the separate final injury inquiry. Its current schedule calls for a finding on December 22, 2026, followed by reasons in January 2027.

If the Tribunal ultimately finds that the dumped or subsidized imports caused injury to Canadian producers, permanent anti-dumping and countervailing measures could follow.

If the required injury finding is not made, the proceedings would end and provisional duties could be refunded in accordance with Canada’s trade-remedy rules.

A broader trade issue

The plywood investigation comes as Canada is increasingly using its trade-remedy system to respond to concerns over heavily subsidized or low-priced imports from China.

For Canadian plywood manufacturers, the issue is particularly significant because the domestic industry’s share of the apparent market has declined while Chinese imports have expanded.

For importers and buyers, however, the immediate impact is the possibility of substantially higher costs on affected products as the federal investigation proceeds.

For now, the key distinction is that Canada has made preliminary findings of dumping and subsidization—not a final determination. The ultimate outcome will depend on the CBSA’s final investigation and the Tribunal’s determination of whether the imports caused injury to Canadian producers.

Sources: Canada Border Services Agency and Canadian International Trade Tribunal. 

Federal Report Questions Financial Case for Rooftop Solar in Canada

Natural Resources Canada memo estimates residential solar systems can take 10 to 30 years to recover their costs, depending on location and circumstances

A federal Natural Resources Canada memo is raising questions about the financial case for residential rooftop solar in much of the country, estimating that homeowners may need between 10 and 30 years to recover the cost of a solar installation.

The May 20 memorandum, prepared for Natural Resources Minister Tim Hodgson and obtained by Blacklock’s Reporter, concludes that the economic case for widespread residential rooftop photovoltaic systems remains limited in most Canadian jurisdictions compared with some international markets.

According to the document, residential systems can cost between approximately $10,000 and $45,000, including associated debt-servicing costs. The length of time required to recover that investment varies depending on electricity prices, installation costs, solar production and other local factors.

Economics vary across Canada

Natural Resources Canada attributes part of the challenge to the economics of the Canadian electricity market.

The department notes that residential solar can be less financially competitive in Canada than in countries such as Australia, where electricity prices are generally higher. Canadian homeowners also face comparatively high installation labour costs, according to the memorandum.

That combination can make the electricity generated by a rooftop system worth less relative to the cost of installing it.

The memo therefore characterizes rooftop solar as an option that is more accessible to homeowners who have the financial capacity to absorb significant upfront costs or take on financing.

Federal incentives helped, but adoption remained limited

Government subsidies can improve the economics of rooftop solar by reducing the homeowner’s initial investment.

The former Canada Greener Homes Grant provided up to $5,000 for eligible home improvements. The program is now closed to new applicants, with applications having ended in February 2024 and final documentation due by the end of 2025.

Natural Resources Canada’s latest program figures show that 38,500 households received grants for solar panels through the initiative. That put solar behind heat pumps, windows and doors, insulation and air sealing among the program’s most common retrofit categories.

The federal memo cited the relatively limited participation as part of the broader challenge facing residential solar.

Solar can provide benefits beyond the homeowner

The department’s assessment does not argue that rooftop solar has no value.

Officials noted that distributed generation could potentially reduce pressure on large-scale electricity infrastructure by producing power closer to where it is consumed.

However, the memorandum also cautioned that determining the value of those broader system benefits is highly dependent on local circumstances and is difficult to apply consistently across the country.

That distinction is important because the financial return experienced by an individual homeowner is not necessarily the same as the broader economic value of distributed electricity generation.

A history of subsidizing renewable energy

The rooftop-solar assessment also echoes conclusions from an earlier federal evaluation of the Renewable Energy Deployment Program.

A 2021 Natural Resources Canada evaluation examined the $1.5-billion program, which provided financial support for renewable-energy projects including wind, solar and geothermal generation.

The evaluation found that the supported projects generally would not have been profitable without the program’s funding. The program provided producers with a direct subsidy of one cent per kilowatt-hour of electricity generated.

The comparison illustrates a recurring issue in renewable-energy policy: projects can deliver environmental or energy-system benefits while still requiring financial support to make their economics attractive to investors or consumers.

The 30-year question

A 30-year payback period is particularly significant for homeowners considering solar as a financial investment.

A system that takes decades to recover its initial cost leaves homeowners exposed to changes in electricity prices, financing costs, equipment performance and maintenance requirements over the life of the installation.

That does not necessarily mean rooftop solar is uneconomic everywhere. The federal assessment itself points to substantial differences between jurisdictions, and the economics can change considerably depending on local electricity rates, solar conditions, installation costs and available incentives.

For some households, those factors can produce a substantially shorter payback period.

The central finding of the federal memorandum is narrower: Canada’s current economic conditions do not make widespread residential rooftop solar financially compelling in most jurisdictions without considering additional benefits or government support.

Solar remains part of Canada’s energy transition

Despite the financial concerns outlined in the memorandum, rooftop solar continues to be part of Canada’s broader effort to expand renewable electricity.

Natural Resources Canada’s final Greener Homes figures show that tens of thousands of Canadian households chose solar through the federal program, while provincial utilities continue to develop their own incentives.

For example, Hydro-Québec introduced a 2026 solar grant providing up to $1,000 per kilowatt installed and covering as much as 40 per cent of eligible costs. The utility said the incentive was intended to reduce current solar payback periods of roughly 25 to 30 years to approximately 10 to 12 years for eligible customers.

The result is a complicated picture for Canadian homeowners: solar technology is becoming increasingly common, but whether installing it makes financial sense remains highly dependent on where a homeowner lives, how much electricity they use, what the installation costs and what incentives are available.

For many Canadians, the question may therefore be less about whether rooftop solar works—and more about whether the numbers work for their particular home.

Source: Natural Resources Canada memorandum. The payback estimates are federal departmental assessments, not guarantees applicable to every household. The Canada Greener Homes figures are independently confirmed by Natural Resources Canada.

Canada’s Economic Gap With the United States Has More Than Doubled

New Fraser Institute study finds Canada has fallen behind the United States on living standards, incomes, investment, employment and productivity since the beginning of the century

VANCOUVER — Canadians are increasingly falling behind their American counterparts on some of the economic measures that most directly affect household prosperity, according to a new study examining the economic performance of Canada and the United States over the first quarter of the 21st century.

The report, “Squandering the Canadian Century: Part 1 — Comparing Economic Performance in Canada and the United States,” was published by the Fraser Institute on September 1.

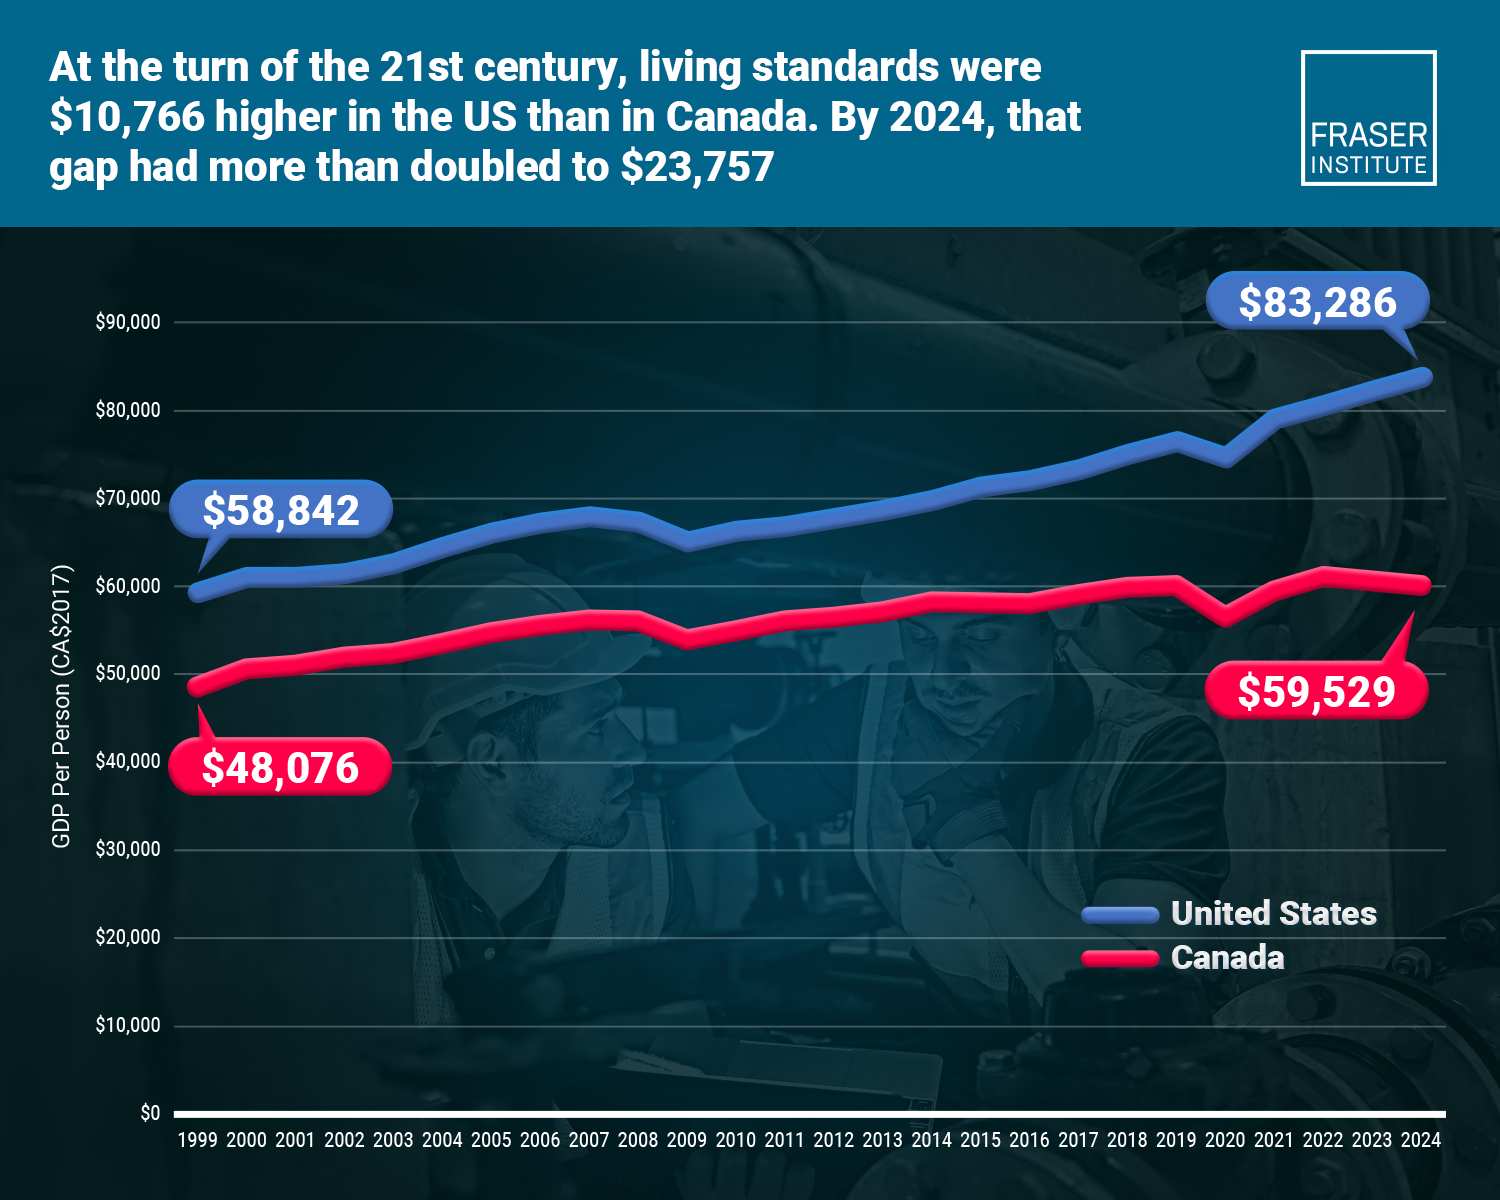
Its central finding is stark: the gap in inflation-adjusted GDP per person between the two countries has more than doubled since 1999.

In 1999, GDP per person in the United States was approximately C$10,766 higher than in Canada.

By 2024, the difference had grown to C$23,757.

The authors — Fraser Institute senior economist Joel Emes, senior policy analyst Grady Munro and director of fiscal studies Jake Fuss — argue that the deterioration cannot be explained by a single economic indicator.

Instead, Canada has fallen further behind across five broad areas examined by the study: living standards, employment income, employment, business investment and labour productivity.

The numbers behind the growing gap

The difference becomes particularly apparent when looking at inflation-adjusted GDP per person.

In 1999, Canada’s figure was approximately C$48,076, compared with C$58,842 in the United States.

By 2024, Canada’s figure had risen to C$59,529.

The American figure, meanwhile, had climbed to C$83,286.

That left the United States with an advantage of nearly C$24,000 per person.

The significance of the comparison is not that Americans necessarily have an additional $24,000 sitting in their bank accounts.

GDP per person is an economic measure rather than a direct measure of household income.

But the widening difference does provide an indication of how much more economic output is being generated per person in the United States — and, over time, that divergence can translate into differences in wages, investment, employment opportunities and government revenues.

For Canadians already dealing with high housing costs, taxes and other household expenses, the direction of the trend is particularly important.

The income gap is widening too

The difference isn’t confined to national economic output.

The study also examines inflation-adjusted median employment income.

In 2010, the earliest year for which the researchers say comparable data were available, median employment income in the United States was approximately C$6,126 higher than in Canada.

By 2024, that difference had increased to C$8,663.

That represents a growing gap in the amount of income earned by the typical worker.

For individual Canadians, that distinction can be much more tangible than GDP statistics.

Higher employment income can mean greater ability to save, invest, purchase housing, support a family or absorb rising living costs.

Canada’s private sector is shrinking as a share of employment

Another difference identified by the study involves the composition of employment.

Between 1999 and 2024, the share of Canadian employment accounted for by the private sector declined from 81.2 per cent to 78.5 per cent.

The authors say this reflects government-sector employment growing faster than private-sector employment.

The United States moved in the opposite direction.

Its private-sector share of employment increased from 85.8 per cent to 86.5 per cent over the same period.

The figures don’t mean that government employment itself is inherently bad or that every public-sector job comes at the expense of a private-sector job.

Rather, the researchers use the trend as one indicator of the different directions taken by the two economies.

A growing private sector can provide a broader base of businesses investing, producing goods and services and competing for workers.

Investment may be the bigger warning sign

Perhaps the most consequential finding concerns business investment.

Investment is important because businesses need machinery, technology, buildings, equipment and other capital to increase production and improve efficiency.

According to the Fraser Institute study, Canada’s business investment per worker has deteriorated significantly relative to the United States.

In 2007, Canadian investment per worker was equivalent to nearly 90 cents for every dollar invested per worker in the United States.

By 2024, that had fallen to just 54 cents.

In other words, for every dollar being invested per American worker, Canadian businesses were investing only about 54 cents.

That matters because today’s investment becomes tomorrow’s productive capacity.

A company that buys better equipment, adopts new technology or expands its facilities can potentially produce more with the same number of workers.

When investment remains weak for years, productivity growth can suffer.

And that’s precisely what the study says has happened.

Canada’s productivity problem

Labour productivity is one of the most important measures in the report.

The study finds that between 1999 and 2025, labour productivity increased by:

Canada: 26.7 per cent

United States: 67.9 per cent

The American increase was therefore more than twice Canada’s.

Productivity essentially measures how much economic output is produced from a given amount of labour.

It doesn’t mean Canadian workers are working less hard than American workers.

Rather, productivity is heavily influenced by the tools, technology, infrastructure, capital and processes available to workers.

A worker equipped with modern machinery and technology can potentially produce considerably more than a worker performing the same task with outdated equipment.

The Fraser Institute argues that Canada’s weak productivity growth is therefore closely connected to its weak investment performance.

Jake Fuss, one of the study’s authors, said the ability to transform inputs into goods and services increased by more than twice as much in the United States as in Canada over the period examined.

The turning point came after 2014

One of the more interesting aspects of the report is that the authors don’t argue Canada was always falling behind.

Instead, they identify 2014 as an important turning point.

According to the study, Canada generally kept pace with the United States — and in some cases exceeded it — across several economic measures before 2014.

The divergence became considerably more pronounced afterward.

The timing is significant.

In 2014, global oil prices began a dramatic decline, creating a major shock for Canada’s energy-producing provinces and reducing investment in Canada’s resource sector.

But the Fraser Institute’s argument is that the oil-price collapse alone does not explain Canada’s subsequent performance.

The broader problem, according to the researchers, is that Canada has struggled to create an economic environment capable of attracting sufficient investment and generating stronger productivity growth.

That interpretation is likely to generate debate.

What does this mean for British Columbia?

While the study compares Canada as a whole with the United States, its implications extend to British Columbia and Vancouver Island.

B.C.’s economy is heavily connected to the United States through trade, investment and tourism.

The province also faces many of the same issues identified in the report, including housing affordability, infrastructure requirements, labour shortages and questions about business investment.

For communities such as those on northern Vancouver Island, productivity and investment aren’t abstract concepts.

They can affect whether companies expand, whether new businesses open, whether major projects proceed and whether younger workers can find well-paying employment without leaving the region.

A national productivity problem can therefore eventually become a local economic-development problem.

Why the comparison matters

Canada and the United States are unusually useful countries to compare.

They share a continent, extensive trade relationships, similar legal and financial institutions and highly integrated economies.

Yet their economic performance has increasingly diverged.

The Fraser Institute study argues that the comparison should force Canadians to look beyond headline employment numbers and ask a more fundamental question:

Is the Canadian economy creating enough wealth and productive capacity to support rising living standards?

The report’s answer is no.

At least, not at the rate necessary to keep pace with the United States.

The policy debate

The Fraser Institute’s conclusions are likely to be controversial.

The organization is a free-market public-policy think tank and has long advocated policies emphasizing lower taxes, reduced regulatory barriers, greater competition and increased private investment.

Its researchers argue that Canada needs significant economic reforms to reverse the trend.

But the underlying economic measurements themselves extend beyond the Fraser Institute’s policy preferences.

The GDP, income, employment, investment and productivity figures are the basis for the report’s comparison, while the interpretation of why Canada has underperformed — and what governments should do about it — is where political and economic debate begins.

That distinction is worth keeping in mind.

The numbers tell one story.

The causes and solutions are more complicated.

A quarter-century of missed opportunity?

When the 21st century began, there was optimism that Canada could emerge as an increasingly prosperous economic power.

A quarter-century later, the Fraser Institute argues that the country has instead watched its economic position deteriorate relative to its largest neighbour.

The report’s title — “Squandering the Canadian Century” — deliberately frames the issue as a missed opportunity.

The authors argue that the first quarter of the century has already been lost and that policymakers now need to focus on reversing the trend rather than accepting slower growth as inevitable.

“After squandering the first quarter of the 21st century,” Munro said, policymakers need to enact reforms that can make the most of the remainder of the century.

Whether Canadians agree with the Fraser Institute’s diagnosis or its proposed solutions, the underlying comparison presents a difficult question for the country.

In 1999, Canada and the United States were already different economies, but the gap in GDP per person was relatively modest.

Twenty-five years later, the difference has more than doubled.

Canadian employment incomes have fallen further behind.

Business investment has weakened relative to the United States.

And American productivity has grown more than twice as quickly.

For Canadians, the most important question may therefore be less about how the country performed over the past 25 years and more about what happens next.

If the first quarter of the Canadian century was a missed opportunity, can Canada change course before the next quarter passes?

Source: Fraser Institute, Squandering the Canadian Century Part 1: Comparing Economic Performance in Canada and the United States, by Grady Munro, Jake Fuss and Joel Emes. The Fraser Institute’s original page was not directly accessible during research, so the article’s figures and findings were cross-checked against the Institute’s September 1 news release and multiple reproductions of the study summary.

Fraser Institute — Squandering the Canadian Century, Part 1

Squandering cdn century pt1 comparing econ performance canada and us infographic